Crypto Funding Rates: How to Find the Best Markets
The Market View page shows all the details we need to open a position aimed at farming funding rates. From the top menu, you can select the exchange you are using. A coin's values are not the same across all exchanges.
Funding rates are not fixed and immutable; they can change, just as market participants change. When researching a market, our goal is to find the one that gives us the best returns with the lowest risks.
Let's take a look at the parameters on the Market View page:
Market View Parameters
SYMBOL: This is the cryptocurrency we will build our position on. We are absolutely not investing in this crypto, as we are solely and exclusively interested in the funding rates we will be paid.
Blue Symbol (in Arbitage list): Indicates that the spot price has outperformed the futures price by at least 3% at least once in the last 6 days. This is positive data for us, but it is not enough on its own to make us choose a market—unless we are opening the position with the sole purpose of trying to hit a take profit on the spot-futures spread. (Expert guide here)
Red Symbol (in Risky Markets list): Indicates that the futures price has outperformed the spot price by at least 3% at least once in the last 6 days. This is a warning sign. It is recommended to check the Risky Markets page to see how large the unfavorable movement was before deciding whether to enter.
Yellow Symbol (in Arbitrage & Risky Markets): Both of the above cases have occurred at least once in the last 6 days.
CURRENT: The percentage value of the next funding rate—meaning how much we will be paid on the total value of our short position.
The payment is based on the current position value (quantity * price), regardless of the leverage used.
Example: If you use $500 with 2x leverage to open a $1,000 position, the payment you receive will be (1,000 / 100) * current rate. It will be exactly the same if you used $1,000 with 1x leverage to open a $1,000 position.
AVG 5: The average of the last 5 funding rates. This is often a more realistic value to use in the calculator.
APR 5: The Annual Percentage Rate based on the last 5 payments.
APR 15, 30, 60: The Annual Percentage Rate based on the last 15, 30, or 60 payments.
Note: 60 payments in a market that pays every 4 hours equals about 10 days. 60 payments in a market that pays every 8 hours equals about 20 days.
Broader parameters indicate stability in funding rate payments and, consequently, the stability of that specific market.
INTERVAL: How often the funding rate is paid, usually every 4 or 8 hours. It is highly discouraged to open positions in markets that pay every 1 hour, unless you are an expert trader and know exactly what you are doing.
VOLUME: How much money is traded within a specific market in 24 hours. Generally speaking, markets with higher volumes prove to be more stable and allow us to enter with larger amounts of capital. Markets with lower volumes increase the risk of our positions being closed, but they tend to pay higher rates. A user might decide to open multiple positions, allocating capital proportionally based on the volume size.
WARNING: Sometimes very high volumes can also be risk indicators.
How do you know if high volume is a sign of a healthy market or a market where something unusual is happening?
It's simple: extremely high volumes paired with massive funding rate returns indicate high-risk markets and should be avoided.
In this example, TUT has a volume of 36 million—well above average—and a return of 2514%.
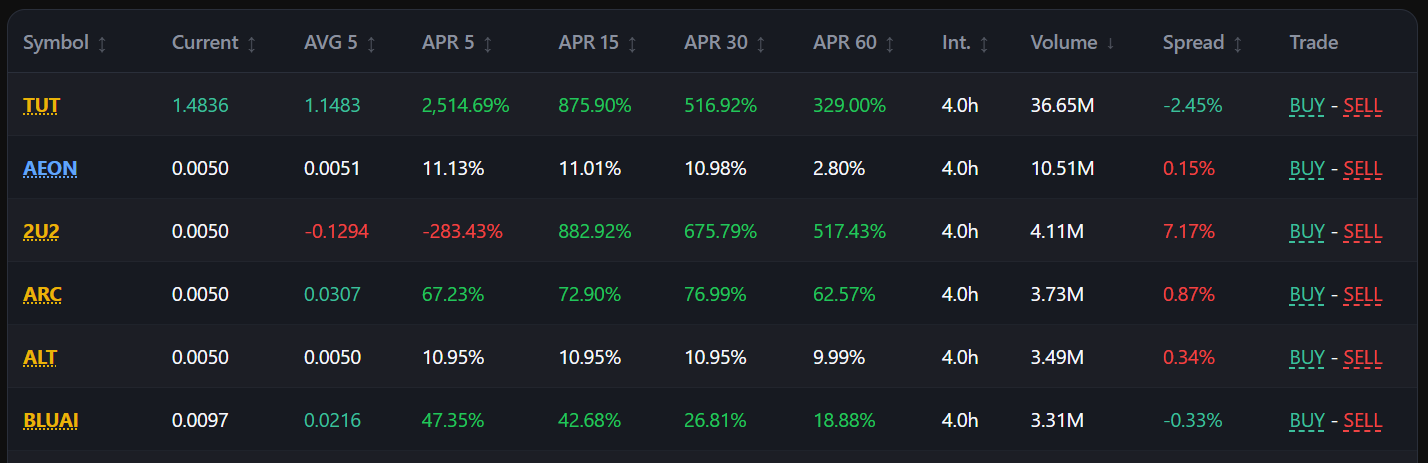
This must be interpreted as a danger signal; there might be some kind of manipulation happening, and it is best to avoid it.
The coins following it have significantly lower (but average) volumes and sustainable returns. Once you evaluate their volatility on the Risky Markets page, these turn out to be preferable to TUT.
SPREAD: The difference between the best spot price and the futures price. In other words, how much you pay (or earn) if you enter a market order at the exact same time on both markets.
Positive (Red): The spot price is higher than the futures price. You will buy your spot at a higher price than your short futures entry.
Negative (Green): You will buy on the spot market at a lower price than the price you are selling at on the futures market.
In this example, we see Siren, which due to its market dynamics has a spot price trading 69% higher than its futures price. Even if all other parameters are good, entering this market would mean securing a large virtual loss from the very moment of entry.

On the other hand, entering with a green spread means starting the position with a profit in your favor. Profit will be realized when the spot and futures prices converge to the same value.
Since positive funding rates (the ones we collect) serve to attract sellers to bring down the futures price, it is likely that when we decide to close the position because the funding rate has dropped, the spread will have closed. This gives us that locked-in profit from opening the position, plus all the accumulated funding.
Note on Spread: Just like everything else, anomalous spread values that are wildly out of the ordinary should be considered red flags. However, a positive (red) spread alone is not enough to make us discard a position. By using the calculator, we might find that even if we pay a spread on entry, a position with high funding rates and a high spread can be more profitable than one with a negative spread but low funding rates.
Important Guidelines for Choosing Markets
Always try to discard extreme values—whether too high or too low—in any field of this table. We are looking for stable markets with few surprises that allow us to keep the position open for a long time.
Also, avoid newly listed markets. When you open a market on your exchange and see only 6 or 7 daily candles, it is best to skip it. In the first few days of trading, significant price deviations between spot and futures often occur.
The Market View page has an Exchange History button at the top. We can check the historical funding rates for every single coin, so we can logically set our automatic exit based on previous values.
Summary Checklist
To summarize, choosing a market depends on a combination of factors:
1) Volatility: How volatile a delta neutral position can be (check Arbitrage / Risky Markets).
2) Returns: How much it pays in funding rates.
3) Stability: How stable its funding rates have remained over time.
4) Liquidity: How much money (volume) is present in the market.
5) Entry Cost: How much it costs you (or how advantageous it is) to enter on a spread.
Diversification is always a good choice.
Open positions across different markets, scale your position size according to the volume (high volume = more money; low volume = less money), and avoid brand-new markets or markets with extreme values.
If you have any questions, always feel free to reach out to support.